Editorial · Data & Systems
Making Data Earn Its PlaceWe Have the Data. Now What?
A dashboard is only valuable when something happens because of it.
DATA ≠ VALUE
Data + decision + action = value
We have never had more access to data.
We can track almost anything: revenue, costs, customers, deadlines, performance, engagement, capacity, risk and progress. We can connect systems, automate reports and turn thousands of rows into polished dashboards with colours, charts and filters.
It looks impressive.
But looking impressive is not the same as being useful.
A dashboard can be technically excellent and still be completely pointless. Because the real value of data is not in how much we collect or how beautifully we display it. The value lies in what we do differently because of it.
If no decision changes, no action follows and no conversation becomes clearer, the dashboard is not a management tool.
It is decoration.
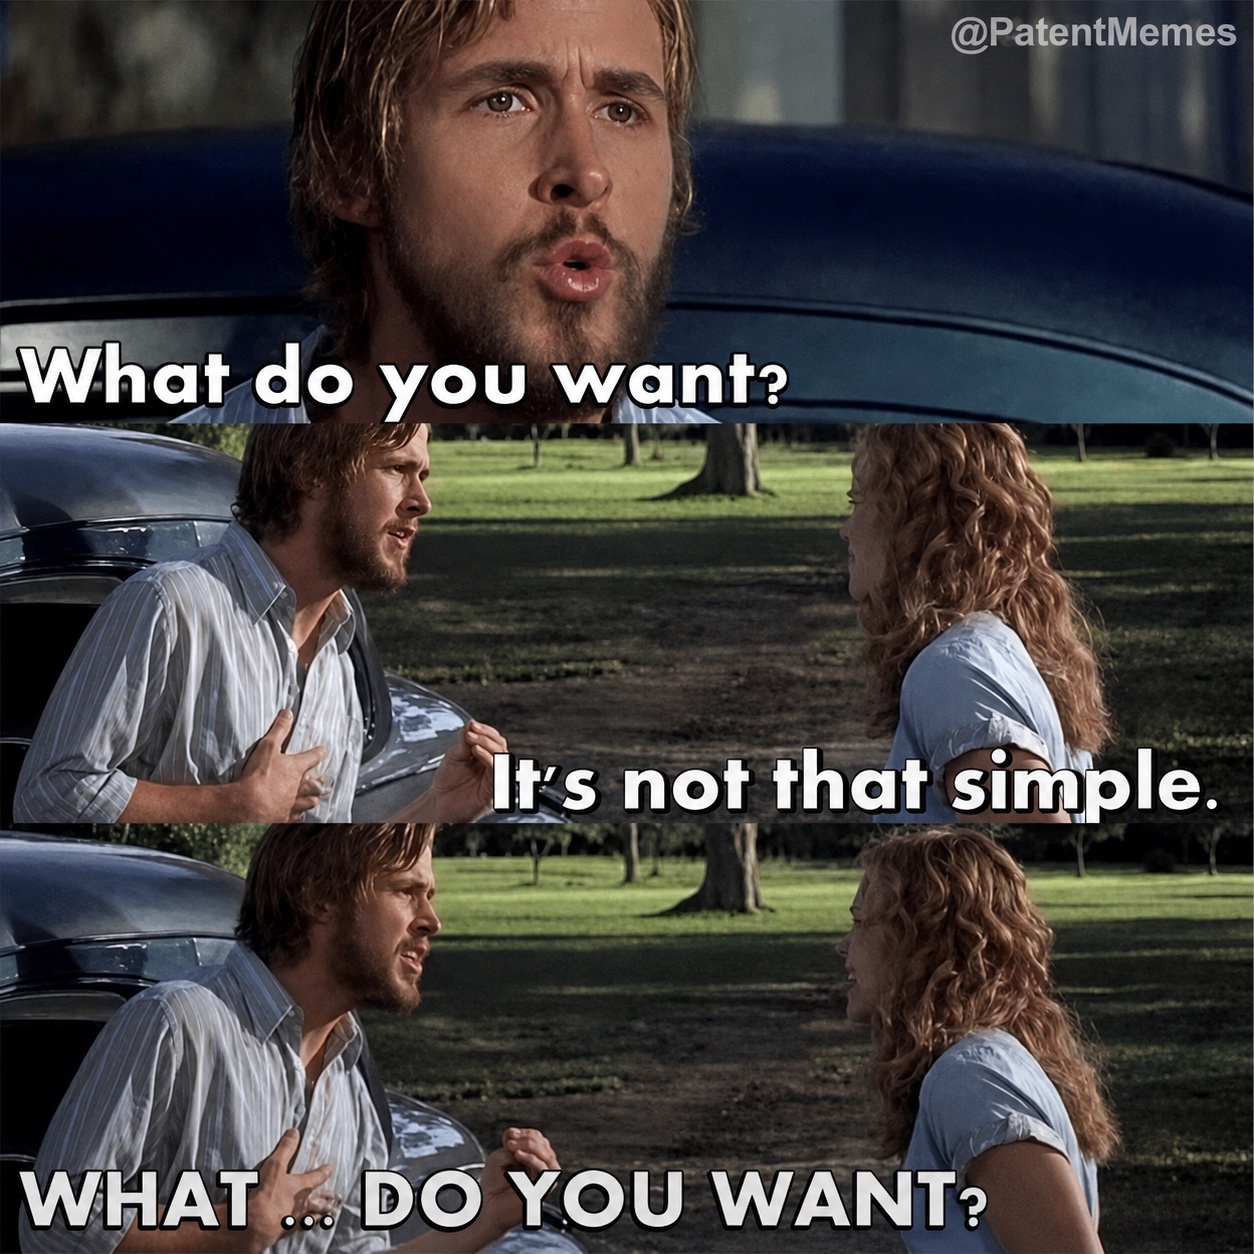
Scene from The Notebook (2004, New Line Cinema). Meme via @PatentMemes.
Start with the decision, not the data
The most common mistake is to begin with what is available:
What data do we have?
That question often produces a dashboard full of everything the system can measure. The result may be comprehensive, but it leaves the user with an even bigger question:
What am I supposed to do with this?
A better starting point is:
What decision are we trying to make?
That single change creates focus. It tells us which data matters, how current it needs to be, who needs to see it and what action should follow.
If the decision is whether a project needs intervention, we may need to see budget consumption, remaining time, staffing commitments and upcoming deadlines together.
If the decision is where to invest limited capacity, we need a different view.
If the goal is to identify risk early, a historical summary is not enough. We need indicators that give us time to act.
The purpose determines the data—not the other way around.
Sometimes the pattern comes before the decision
"Start with the decision" is useful advice—but it assumes we already know what decision needs to be made.
Sometimes we do not.
Sometimes the purpose of exploring data is to understand the situation well enough to ask a better question.
We look for repetition, exceptions, changes, gaps and relationships. Somewhere in the data, there may be a pattern that reveals where attention is needed.
And if there is no consistent pattern, that can be meaningful too.
The absence of a pattern may point to fragmented processes, inconsistent behaviour, poor data quality or an assumption that does not hold up under examination.
In exploratory work, the chain begins slightly earlier:
Data → pattern → question → decision → action
But finding a pattern is not the same as finding an explanation. A pattern is a signal. It tells us where to investigate—not automatically what to conclude.
The goal is still action. Exploration becomes valuable when it helps us identify a meaningful question, test what we think is happening and eventually make a better decision.
So perhaps the real principle is not always "start with the decision."
It is:
Know whether you are using data to answer a question—or to discover which question is worth asking.
From numbers to action
Useful data should create a short, visible chain:
Question → signal → decision → action → result
Without that chain, organisations often stop at the signal. They build a dashboard that shows a red number, but no one knows who owns it, when it should be discussed or what red is supposed to trigger.
That is not a data problem.
It is an operating-model problem.
More data can create less clarity
There is a temptation to believe that more data leads to better decisions. Sometimes it does. But more data can also create noise, delay and false confidence.
When every metric is treated as important, nothing is prioritised.
When every team receives the same dashboard, context disappears.
When a report contains twenty charts but no clear question, people scan it, nod and return to working exactly as before.
Good data work is therefore partly an exercise in restraint.
The strongest dashboard may not be the one with the most information. It may be the one that makes three things unmistakably clear.
1. What is happening?
2. Why does it matter?
3. What should happen next?
Everything else must earn its place.
A dashboard is part of a system
A dashboard does not create change by itself. It must be connected to the way people actually work.
Who reviews it? How often? Which thresholds trigger action? Who owns the follow-up? Where is the decision documented? How do we know whether the action worked?
These questions are less glamorous than choosing charts and colours, but they are where the real value is created.
The best dashboard is not necessarily the one people open every day. It is the one embedded in the right meeting, process or decision at the right moment.
It reduces uncertainty. It directs attention. It helps someone act earlier or choose better.
Sometimes the right output is not even a dashboard. It may be an alert, a prioritised list, a short weekly briefing or a single exception that requires attention.
The format should serve the decision—not our desire to display what we have built.
Before building, ask five questions
- What decision should this support?
- Who is responsible for making that decision?
- What action should different signals trigger?
- How current and reliable must the data be?
- How will we know whether it created value?
If those questions cannot be answered, the problem is not that we need a more advanced dashboard.
We need a clearer purpose.
Data can reveal patterns, challenge assumptions and make complexity manageable. It can help organisations see problems sooner and allocate time, money and attention more intelligently.
But data does not create value merely by existing.
It creates value when it is understood, connected to responsibility and used.
Do not begin by asking what you can show. Begin by asking what needs to change.